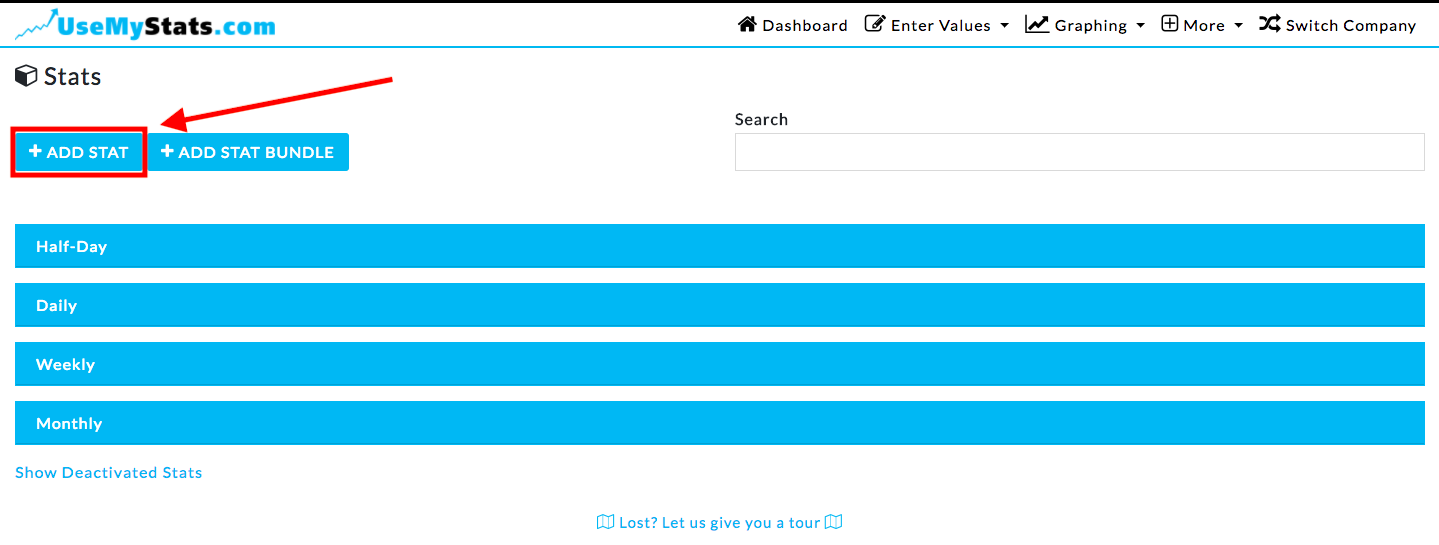
Creating a new stat is quick and easy! This article covers how to add a new stat with the basic settings.
Start here, at "More", then "Statistics".


You will need to enter a few pieces of information before you can save and enter values for your stat. First, enter the name of your stat.
Then, set the time period, which tells us how much time this stat reflects. For example, if you are collecting the number of deliveries done each day you would select daily. If you want to collect number of deliveries done weekly, you would select weekly.
You can also select the number of decimals you want. If you are working something like "number of donuts sold", you would probably want to work in whole numbers and would select "0". If you are working with money, you could select "2" so the dollars and cent amounts will show.
You can also select whether you would like to "always show decimals". This means that if you select to show two decimal points, and enter the value four, it would show on the graph as "4.00".
You also have the option to have extra symbols around the value. If you entering values involving dollars or percents, and accompanying "$" or "%" could be helpful!


There are additional options for each statistic which can be accessed by clicking the arrow next to ""Advanced Settings", but for simplicity, this article only covers the basics of how to create a new stat. To see the Advanced Settings information, click the link here.

